Let’s learn Data Science in-depth
What is Data Science? A Complete Beginner-Friendly Data Science Guide
Introduction to Data Science
Imagine you’re tasked with finding out what makes a song a hit or predicting how the weather will change tomorrow. These are examples of how people use Data Science—a blend of art and science that helps us make sense of the world using data.
Definition:
Data Science is the process of collecting, analyzing, and interpreting data to extract valuable insights and make informed decisions. It combines mathematics, computer science, statistics, and domain expertise to solve real-world problems.
Why is Data Science Important?
Data Science is everywhere! From recommending your favorite Netflix shows to improving healthcare treatments, it touches every part of our lives. Here’s why it matters:

- Empowers Decision-Making: Companies use it to decide which products to launch or how to improve customer experiences.
- Solves Complex Problems: Data Science helps us tackle challenges like climate change, disease outbreaks, and fraud detection.
- Reveals Hidden Patterns: By analyzing data, it uncovers trends we can’t see with the naked eye.
Breaking Down Data Science: Step by Step
1. Data Collection
Everything starts with data. This step involves gathering raw information from various sources such as:
- Websites (e.g., using APIs to fetch user activity data).

- Surveys (e.g., collecting opinions about a product).
- Sensors (e.g., monitoring weather conditions).

- Databases (e.g., sales data from an e-commerce platform).
Example: A school wants to find out why students are dropping out. They collect data about attendance, grades, and family background.
2. Data Cleaning
Data is often messy. Cleaning involves:
- Fixing errors (e.g., correcting typos).
- Removing duplicates.
- Handling missing values (e.g., filling gaps in survey responses).
- Formatting data consistently (e.g., changing “yes/no” to 1/0).
Fun Fact: Analysts spend about 80% of their time cleaning data! It’s like organizing a messy closet before finding your favorite shirt.
3. Data Analysis
This is where the detective work begins. Analysts use tools and techniques to explore the data, ask questions, and find patterns.
Descriptive Analysis: What happened? (e.g., 60% of users prefer product A).
- Purpose: Descriptive analysis focuses on summarizing historical data to understand what has already occurred. It provides insights through metrics, trends, and visualizations.
- Examples:
- Business: An e-commerce company finds that 60% of its users prefer Product A over Product B, indicating its popularity.
- Healthcare: A hospital tracks the number of patients admitted for flu over the past five years to identify seasonal trends.
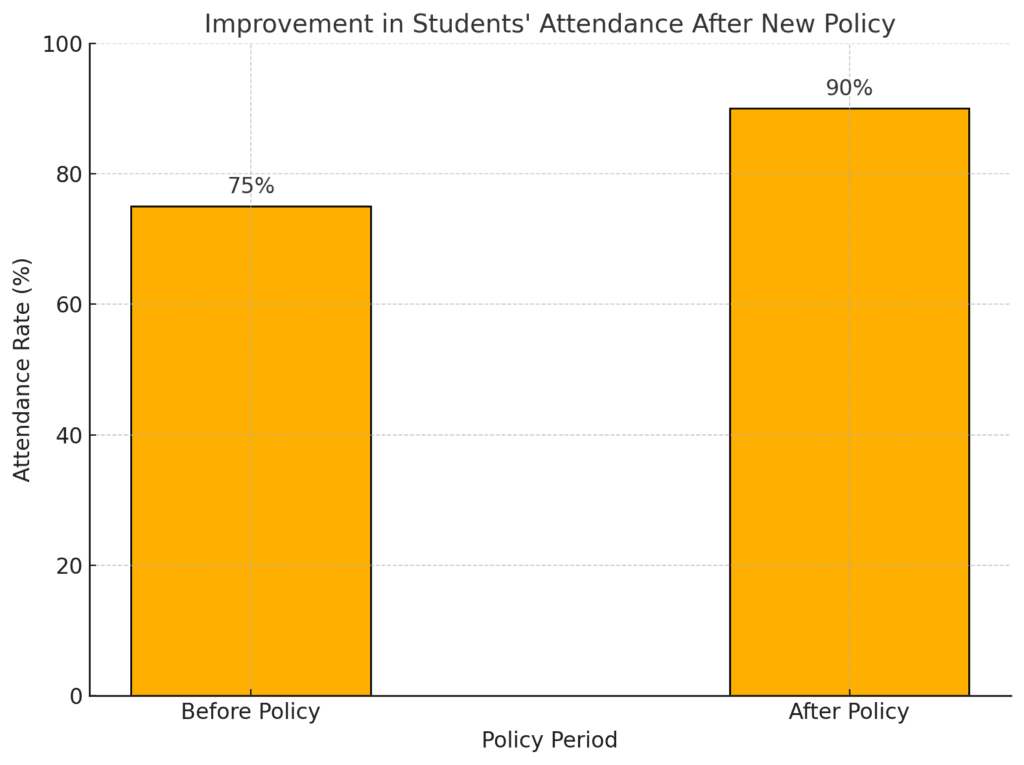
- Education: A school analyzes student attendance rates for the past semester to evaluate policy effectiveness.
- Common Techniques:
- Summarizing data with averages, percentages, or counts (e.g., mean revenue per customer).
- Creating dashboards and reports using tools like Tableau or Power BI.
- Visualizing trends with graphs and charts to make patterns more apparent.
- Value: Descriptive analysis sets the foundation for further analysis by organizing and summarizing raw data into a format that’s easy to interpret
Predictive Analysis: What will happen? (e.g., predicting next month’s sales).
- Purpose: Predictive analysis uses historical data and statistical models to forecast future outcomes. It focuses on identifying patterns and making data-driven predictions.
- Examples:
- Business: A retailer predicts sales for the upcoming holiday season based on past trends, allowing them to stock the right inventory.
- Finance: Banks forecast credit risk by analyzing a customer’s transaction history and credit score.
- Sports: A team predicts player performance for the next season using metrics like goals scored or injuries sustained.
- Techniques and Tools:
- Machine Learning Models: Regression, decision trees, and neural networks help make accurate forecasts.
- Data Sources: Input data might include historical sales figures, weather conditions, or customer preferences.
- Challenges:
- Predictive models require clean, high-quality data for accuracy.
- Assumptions made during modeling can affect the reliability of predictions.
- Value: Predictive analysis equips organizations with foresight, enabling proactive strategies rather than reactive decisions.
Prescriptive Analysis: What should we do? (e.g., offering discounts to attract more buyers).
- Purpose: Prescriptive analysis goes beyond prediction by suggesting actionable steps to optimize outcomes. It often involves simulations or advanced algorithms.
- Examples:
- Retail: Based on predicted demand, a store offers discounts to encourage customers to buy slow-moving items.
- Healthcare: Doctors receive AI-driven recommendations for the best treatment options based on a patient’s medical history.
- Transportation: Ride-sharing apps like Uber suggest optimal routes to drivers and adjust prices dynamically based on demand.
- Key Components:
- Optimization Models: Mathematical techniques to determine the best course of action (e.g., minimizing costs or maximizing revenue).
- Scenario Analysis: Simulating different strategies to see which yields the best results.
- Challenges:
- Prescriptive analysis requires robust predictive models as its foundation.
- Implementing recommendations may involve operational changes or additional resources.
- Value: Prescriptive analysis helps organizations make decisions with confidence, ensuring that actions are aligned with data-driven insights.
4. Data Visualization
Data is easier to understand when presented visually. Tools like graphs, charts, and dashboards make it simple to see trends.
Example: A bar chart showing how much students’ attendance improves after introducing a new policy.
5. Decision-Making
Insights from data help businesses, governments, and individuals make better decisions.
Example: A company uses data to decide which new market to enter or how to personalize ads for users.
What Skills Does a Data Scientist Need?
If you’re excited to dive into Data Science, here’s what you’ll need to learn:
- Mathematics & Statistics: Understanding probabilities, averages, and trends.
- Programming: Tools like Python and R are essential for working with data.
- Data Visualization: Creating charts and graphs using tools like Tableau or Matplotlib.
- Domain Expertise: Knowing about the field you’re analyzing (e.g., healthcare, finance, sports).
Where is Data Science Used?
1. Healthcare
- Predicting disease outbreaks.
- Personalizing treatments based on patient data.
2. Entertainment
- Suggesting movies and songs based on your preferences (e.g., Spotify, Netflix).
3. Environment
- Monitoring air quality and predicting natural disasters.
4. Education
- Identifying students who need extra help based on performance data.
5. Business
- Understanding customer preferences to improve products.
Tools of the Trade
Here are some popular tools every beginner should know about:
- Programming Languages: Python, R, SQL.
- Data Analysis Tools: Pandas, NumPy.
- Visualization Tools: Tableau, Microsoft Power BI.
- Machine Learning Libraries: Scikit-learn, TensorFlow.
No worries! we teach everything on this platform.
How to Start Your Data Science Journey
- Learn Python: Start with beginner tutorials on YouTube or platforms like Kaggle.
- Explore Free Datasets: Practice with public datasets from Kaggle, Google Dataset Search, or Open Data Portals.
- Build Projects: Try small projects, like predicting house prices or analyzing movie ratings.
- Stay Curious: Read blogs, watch videos, and explore real-world applications.
Common Questions About Data Science
1. Is Data Science hard to learn?
Like any skill, it takes practice, but anyone with curiosity and patience can learn it.
2. Do I need a strong math background?
Basic math helps, but you’ll pick up advanced concepts as you go. Start with the basics of statistics.
3. Can I become a Data Scientist without coding?
Coding is essential for advanced tasks, but tools like Excel and Tableau allow non-coders to perform basic data analysis.
Conclusion
Data Science is the future, transforming industries and our daily lives. Whether you’re 14 or 40, starting your journey into Data Science can be fun and rewarding. Remember, it’s not about being a genius—it’s about asking the right questions and being curious about the answers hidden in the data.
Related topics: “Ethical Concerns in Data Science”
References
- Andrew Ng’s Machine Learning Course
Ng, A. (n.d.). Machine Learning. Coursera. Retrieved from https://www.coursera.org/learn/machine-learning - Data Science and Predictive Analytics. Dinov, I. D. (2018). Data Science and Predictive Analytics: Biomedical and Health Applications using R. Springer. DOI: 10.1007/978-3-319-89633-3
- IBM Data Science Blog. Data Science Concepts and Use Cases.
- MIT OpenCourseWare. Massachusetts Institute of Technology. (n.d.). Introduction to Computational Thinking and Data Science. MIT OpenCourseWare. Retrieved from https://ocw.mit.edu/courses/electrical-engineering-and-computer-science/6-0002-introduction-to-computational-thinking-and-data-science-fall-2016/
- Provost, F., & Fawcett, T. Data Science for Business: What You Need to Know About Data Mining and Data-Analytic Thinking. O’Reilly Media.
